Data Analysis with AI: Artificial Intelligence in Google Sheets
17 İyul 2026·👁 13 views
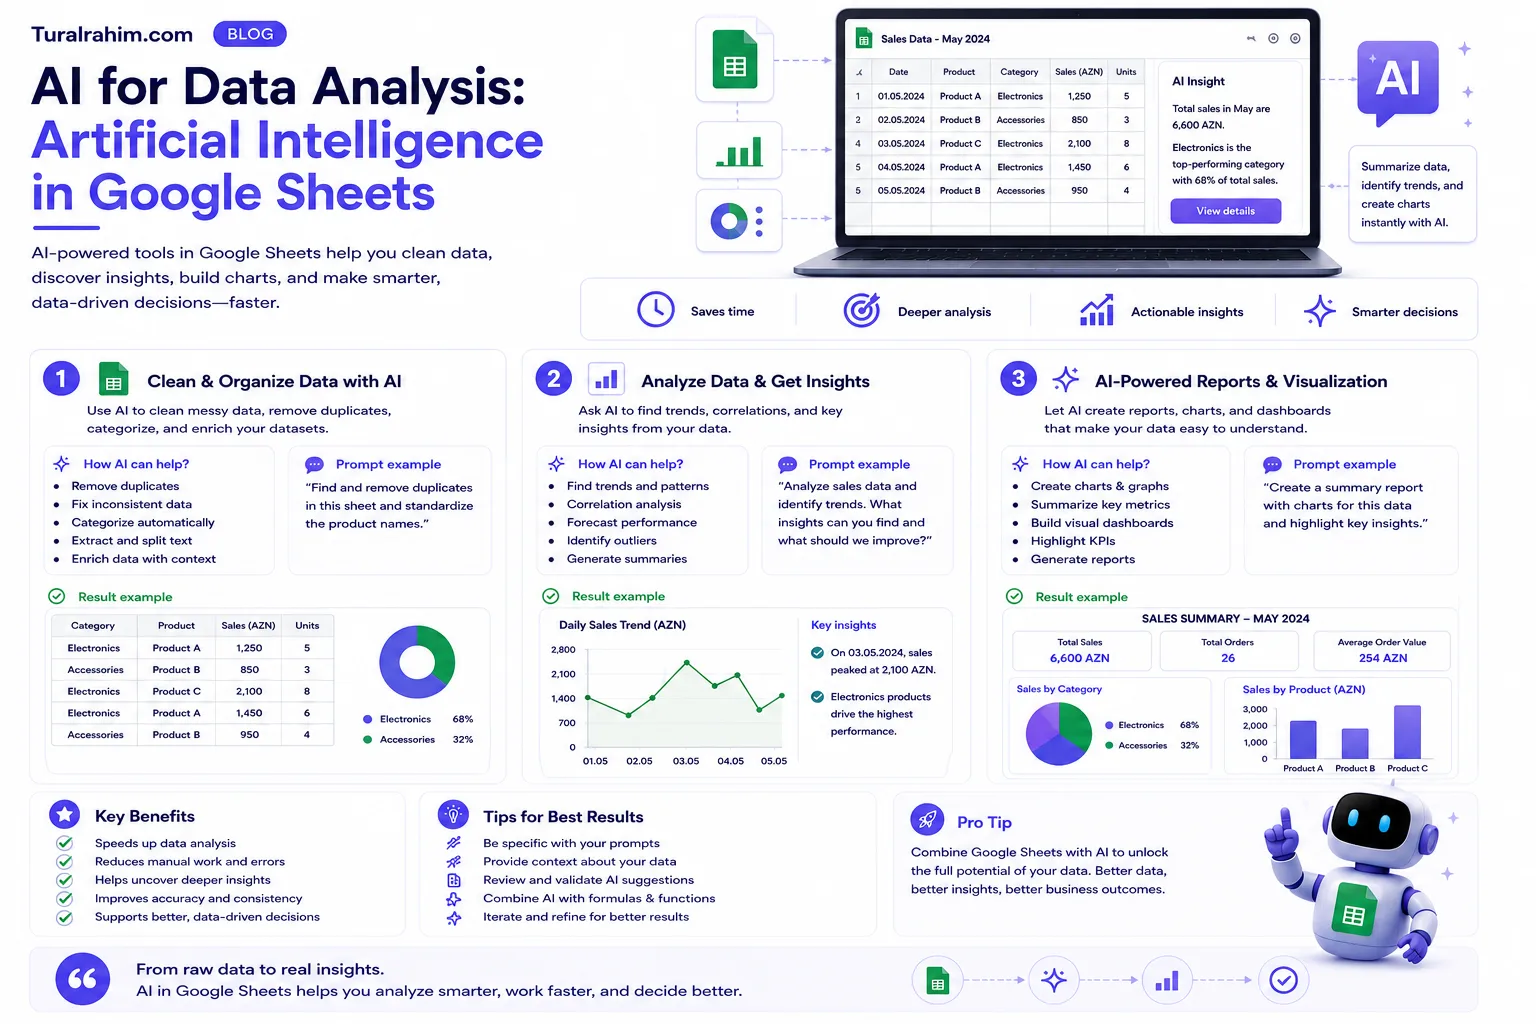
If your eyes turn dark when you see a table, this post is for you. AI reads the data for you, cleans it, categorizes it, and graphs it without even writing a formula. Becoming an Excel master is no longer a requirement — all you have to do is say what you want in simple language.
But there is a condition, and half of this article is dedicated to: AI is able to make mistakes in the dataset and the error seems convincing. So I'll show you both how to use it and how to check it.
This post What is Artificial Intelligence (AI)? the application portion of its guide.
What's Changing in 📊 AI Data Analysis?
Traditionally, data analysis required two things: specialized knowledge (formulas, tools) and plenty of time. AI eliminates both.
Now it works: you give a mixed dataset, you ask a question in its usual language, you get an answer. You're not writing a formula of “Is this month's sale more or less than last month?” — you're just asking.
Stronger: AI different type dataset at the same time they can understand. For example, you could put together customer reviews with sales figures and ask, "What did customers complain about the month of the sale?"
I want to emphasize something, because most of them misunderstand it: AI doesn't replace your analytics-it transforms you into analytics. In the past, it took either a specialist who learned this work or years to make sense of the dataset. Now, a person who knows his business well, but has no technical knowledge, can also “talk” with his data. This is a big change, especially for small businesses — because most don't have analytics in their state.
Golden Rule: AI analyzes the data, but you decide. He might say, “sales fell 20%;” and you know what that means and what it means to do it, and only you — the person who knows your business — can do it.
🔒 Before we get started: Data Privacy
I put this section before I can, because it's the most important, and most mistakes start here — once done, they can't be undone.
Do not upload private information to an open AI tool. What does this mean?
Personal information of customers (name, phone, address, card number).
Company internal financial figures.
Agreements, price agreements.
Employee information, salaries.
The information you upload is out of your control. There are two solutions: use a corporate (enterprise) tool approved by your company, or delete/hide personal information before downloading the dataset. For example, for analysis, the customer's name is missing, but only "Customer 1, 2, 3".
Many tools also have the ability to turn off the use of your conversations for teaching in their settings — watch it once and turn it off.
🧹 Clearing and Structuring Datasets
80%of the real data is cluttered: different formats, spaces, numbers in the picture, information inside the text. AI makes it work.
Figure to table
One of the most impressive amenities: structuring the data in the image or PDF.
"Extract the information in this screenshot and turn it into a table. Columns: date, product, quantity, price.”
Dozens of lines of AI you'll manually transfer in seconds. Then you move this table to Google Sheets or Excel and move on to your work. This method is especially invaluable for digitizing old paper documents, hand-painted forms, or information that came out of another system, such as screenshots — work that once took days now hangs around the clock.
Dividing text into categories
There are hundreds of customer reviews, support requests, or inquiry responses, and you don't have time to read any of them. AI categorizes each one:
“Divide the following reviews into categories: positive, neutral, negative. Then you get the 3 most repeated of the negatives.”
You can also apply this to an entire column in Google Sheets-writing its category in front of each review. As such, a thousand line qualitative analysis ends in a few minutes.
AI function in Google Sheets
This is a real game-changer for marketers. Instead of the usual formula in Google Sheets you can write instructions in your own words.
For example, there are customer reviews in column B. In a new column, you write:
=AI(“Classify this review as positive, neutral, or negative,” B2)
Then you drag this formula down — and a thousand lines are classified in a few seconds. In the past, you either had to manually read each review or set up a complicated formula.
With this feature, you can automate any quality analysis: categorizing reviews, grouping answers to open questions, categorizing product names. Only match the instruction to the task each time.
Note : This feature is available on Google's paid AI plans and now works more stable with only English instructions.
Asking Questions in 💬 Simple Languages
This is the real strength of AI in data analysis: you don't need to know the formula. You're asking the question in its usual language.
“What are the top 5 grossing products?”
“Which month was the weakest and for how long?”
“Compare average revenue per channel.”
“Show the difference between these two periods in percentage.”
Previously, you had to search for a formula for each of these, or ask someone. You're asking now.
Better yet: the answer and the formula you don't understand Could you please explain to AI. “What does this formula do?” or “Why does it go wrong in this formula?” -the fastest way to learn how to do business with data.
📈 Graphing and Visualization
When numbers stay on the table, someone doesn't look at them. When turned into a graph, it tells a story-the human brain quickly grabs the picture, not the number column.
"Show monthly sales in a column graph. Make the highest month stand out.”
AI builds a timeline, and you move it to a presentation or report. If your manager doesn't like to read a schedule (most don't), this is your top assistant.
One step further: together with the schedule explanation ask for it. "Explain the trend that appears in this graph in 3 sentences, and say the possible reasons.“ So it's both visual and story-telling. The graph answers the question of what it shows, and the explanation answers the question of why — and for the decision maker, the second is important from the first.
🔗 Merging Different Sources
Here's the most powerful but least used amenity of AI: connect datasets that seem irrelevant to each other and find a connection.
Here's how we usually work: we look at sales numbers separately, customer reviews separately, and ad spend separately. Each stays on their own schedule and we don't see the connection between them.
And AI can "see" all at once:
“I'm giving you two pieces of data: monthly sales figures and customer reviews of those months. Which theme is growing in reviews in the months leading up to the sale? Is there any connection between them?"
This question will take a person hours — two tables side-by-side looking for patterns. AI does this in minutes. The answer is sometimes unexpected: for example, in all of the months of falling sales, the complaint of "delivery is slow" has increased — that the sales problem is actually a logistics problem.
One condition: AI correlation finds (things that change together), but Cause no. Changing two things together doesn't mean one causes the other. It's your job to find the cause.
🔮 "If anything?" Scenarios
Data doesn't just show the past-it also helps you plan for the future. You can set up interactive “what if?” scenarios with AI.
“According to my data: if I increase my price by 15%, but as a result of that sales fall by 10%, how does my gross income change? Show result."
Some tools have gone above and beyond interactive calculator able to set it up-you can swipe the slider and see a vivid change in the result. This is invaluable to show the team the logic of the decision, rather than a dry schedule.
But keep in mind: this is forecast, not a guarantee. AI calculates based on the assumptions you make — if the assumptions are wrong, the result is wrong.
❓ What Indicators Should I See?
The most common challenge I find is not analysing the dataset — not knowing what to look for. You have a hundred columns and you don't know which one is important.
This is where AI takes on the role of an advisor. But the mystery is in context again:
“I run a small online store. My main goal is to increase repeat purchases this quarter. I prepare a presentation to management and they are most interested in profits. What 5 metrics should I focus on for this purpose and why?”
Take care-there are three things in question: your business, your purpose, and your audience. If you don't, the AI will give you a general list, and when you do, just right for you will offer indicators.
Then, a step further: “What tough questions can management ask about one of these metrics?“ So you know firsthand what to look for and how to defend.
⚠️ Most Important Skill: Testing
Now we've come to the most important part of this post. able to hallucinate — and this is particularly dangerous here, because the number seems convincing.
Why is AI wrong in math?
Because the model doesn't calculate the numbers — estimates how the calculation will look. Modern tools know this and transfer the calculation to a real calculator in the background, but it doesn't always happen. Don't trust it-check it out.
How to check
Compare with the simple formula. AI says “gross income is 85,000 manat” on Google Sheets
=SUM()write and check it out for yourself. Does it work?Logic test. Does the number look realistic? Compared to last year? What does your experience say?
Ask for calculation steps. “How did you calculate this result?“ Some tools show code in the background — you can catch the error from there.
Golden Rule: Before delivering every digit AI gives to your supervisor or customer please check at least one way. For the wrong number, no AI, you'll respond.
📌 Real Example: Decide From a Review Setup
Let's see the theory in real work. Let's say you have a small online store and 300 customer reviews have been collected in the last three months. You don't have time to read them, but you feel like you need to change something.
This is how the chain is set up (on each step beforehand):
Step 1: "Divide these 300 reviews into categories: delivery, product quality, price, customer service, other. Count how many reviews there are in each category.”
Results You see, 45%of complaints are about delivery. You didn't know it-you were concerned about the quality of the product.
Step 2: “Read delivery complaints. What are they specifically reporting — delay, packing, or anything else?”
Results It turns out that the problem is not the delay, but the damage to the product — that is, the packaging problem.
Step 3: “What should I look at in my information to check this issue?“ AI tells you which numbers to check (percentage of returns, more on what products).
Step 4: “Set up a 30-day resolution plan for this issue.”
Please note: you decided on the dataset — and you could stop every step of the way and say, "Is that right?" If you were to say, “Analyze reviews” with a prompt, you might not get that depth. This is the prompt chain it's on data.
🚀 Practical Workflow
Let's all connect, so you're preparing a quarterly sales report:
1. Clear the dataset — AI builds a cluttered file into the structure (delete personal data in advance).
2. Get a general view — “summarize key numbers”.
3. Dig in — ask specific questions.
4. Check — confirm key numbers with formula.
5. Visualize — set up a graphic and explanation.
6. Pre-empt any questions that management may have: “What 5 questions can the lead reviewing this report ask?”
The last step is especially valuable-you find your weak spots before the presentation. Your manager can't catch you unprepared because you've already heard their questions.
Please note: only one of these six steps (steps 2 and 3) is “Analyze to AI”. The rest is to clean, check, visualize, and prepare-that is, AI enters every stage of your workflow, not just the middle. That's why data-driven AI is not a tool, an entire co-worker.
❓ Frequently Asked Questions
I don't know Excel, can I use it again?
Yes — that's why AI changed data analysis. You're asking a question in the usual language, you don't need to know the formula. Even the opposite: AI can teach you Excel/Sheets formulas. “How do I make this calculation in Sheets?” will show you step by step.
How many rows of data can I provide?
This is from the tool and from context window depends. In very large datasets, the best way is to upload the file (no copy-and-paste) or use Google Sheets integration directly. Gemini is strong in this regard.
How much can I rely on analyzing AI?
Very reliable for general trends and textual analysis (dividing reviews into categories). Always check for exact numbers. Simple rule: for direction, check for exact number.
Which tool is best for data?
If you're working with Google Sheets, Gemini (which has direct integration), ChatGPT is also powerful for overall analysis. Details: comparison spell.
How do I hide personal information?
Simplest method: replace names with "Customer 1, 2, 3" and remove phone/card numbers. It's not who you are for analysis, but the numbers themselves. You will return the names in your own file later.
Could there be bias in AI analysis?
Yes, and it's an eye-opener. AI can “tweak” the dataset towards the answer you expect-especially if you ask the question for a referral. If you say, “Why is this product bad?” your AI will look for and find evil, even if it's data neutral. Ask a neutral question: “What do reviews about this product say?" If the answer also appears to be one way, ask clearly: "Is there a counterpart? What do positive reviews say?”
Is it useful to double-check the analysis in another tool?
Yes, it's one of the simplest ways to check. Give an important result to two different tools (e.g. ChatGPT and Gemini). If the two give the same answer, it's most likely straightforward; if it says differently, then one has a problem and needs to look deep. This is especially true in numerical analyses.
Conclusion
AI has democratized data analysis-you can now make sense of data without analytics. This is a great release.
But freedom brings responsibility: it's the AI that shows the number, you sign it. That's why you'll remember something from this post, and let's do it — check every important number the AI gives you once in a while.
Try something this week: give your old data file (without personal knowledge) to the AI and ask, “Is there a trend I'm overlooking here?” Then check out the most important number on Google Sheets yourself. Two actions — one will show you something new, the other will teach you when to trust AI. The whole neighborhood of data work is summed up in these two habits: be interested and check.
One last step — researching and planning: Research and Planning with AI: Deep Research, NotebookLM, and Gems

About the author
Tural Rəhimov
Digital Marketing Manager — UM Azerbaijan
Digital marketing manager at Universal McCann (UM Azerbaijan). Experienced in Google Ads, Meta Ads, TikTok Ads and media planning. I help brands grow online.
More about me →Need digital marketing support for your business?
Let's talk — I can help with everything from strategy to ad management.